

I got off this call and thought, I have just seen the future.
But I want to be careful here because I started this series to push back against AI hype. My whole complaint about AI content is that somebody stands on a stage, says the word “transformative” nine times, and every CFO in the room is sitting there thinking but what button do I press? What’s actually worked for someone?
So let me be specific about what I mean.
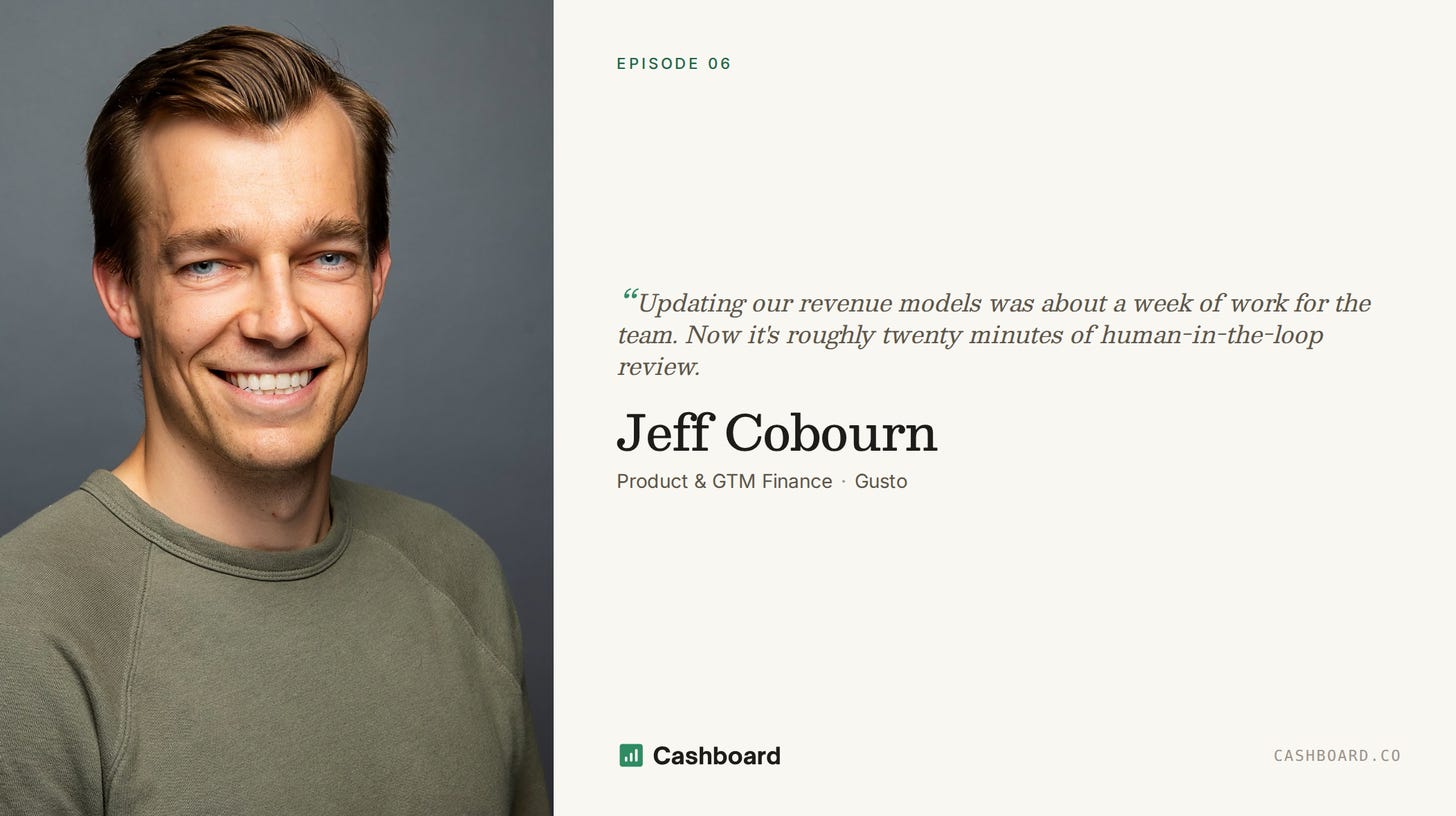
Jeff Cobourn leads product and go-to-market finance at Gusto. His team owns 30-plus revenue models across 40-plus products. A year ago, he scored his team’s automation at zero. Six months ago, still zero. Today, close to 80%. Their monthly forecasts are moving out of Google Sheets into Python.
Business partner meetings start at the problem solving. Actuals populate automatically from Snowflake, models automatically reforecast, an agent drafts the performance commentary and a human reviews it, and the partner has read both before anyone gets on the call.
His team is within weeks of having granular reforecasts produced one day after accounting close. The monthly grind behind that, hitting execute on a query, downloading the CSV, pasting it into a sheet, dragging formulas, re-forecasting the future periods, is something a lot of companies can’t do at all at this level of detail. At Gusto it used to take a week. Now it can be a few minutes of human review.
So when I say I saw the future, it’s because of the outcomes Jeff has achieved. They have every record from every system landing in one warehouse. They spent a year tying data labels to a single master meaning. They put their finance code in GitHub, which solves a coordination problem around individual Claude workstreams on different people’s computers that most teams haven’t even noticed they have yet. And they have speed to insight, because the day after the books close, every operator knows exactly what happened in their business.
This was a fun one. I talk to CFOs about AI 50 hours a week and Jeff’s team is doing things I’ve never heard anyone else talk about. Let’s get to it.
If you only read one thing, my top 5 highlights
Zero to 80% in six months. It started with monthly hackathons, OpenAI one month, Anthropic the next, Cursor after that. A full day, teams competing, just building things. Gusto’s team spent a year experimenting before any of it turned into production work, and then automated ~80% of their FP&A tasks in just six months.
Spreadsheets have earned eternal peace. They’re calling it Project SHEEP. Gusto’s revenue models are moving out of Google Sheets and fully into Python that runs in Streamlit inside Snowflake, writing back to a shared finance data table where the models talk to each other. A week of work becomes twenty minutes of review. Forecast delivery can move from five days after accounting close to one.
The agents that check the work matter more than the agents that write it. Vibe-coding a model gets you 80% fast, and the last 20% is where the time goes, because you no longer know every cell. You didn’t build every cell. So Jeff built an agent that scores a model, flags could be wrong, and renders every calculation as a flowchart that is easy to understand visually.
Their finance team runs version control through GitHub. If everyone on your team is building with AI, all that work ends up scattered across individual desktops. Gusto put their finance code in a shared repo instead, so every tool the team has ever built sits in one place everyone can reach.
None of it works without the data foundation underneath it. The semantic layer took many months of unglamorous work with Gusto’s data team, defining canonical fields one product at a time, so that “how many customers did we have last month” resolves the same way for everyone who asks. That sits on top of a unified warehouse that colocates all of it, which has probably been evolving for the better part of a decade. The AI work of the last six months is the visible part of a much longer build.
Jeff’s path, and what he owns
Julian: Let’s start with your background and your career path.
Jeff: I’m from Toronto. I started my career in traditional finance, found myself investing in software companies in San Francisco, and then realized I should go learn what it’s actually like to build one. I joined Gusto about eight and a half years ago.
My focus has always been how we accelerate revenue growth. My team covers both product and go-to-market. We help think about what products we build, in what order, for whom, how we price them, how we get them into customers’ hands, how we resource the teams, how we think about ROI across teams. Tactically, we own all the revenue models. We’ve got 40-plus products, so we maintain 30-plus revenue models.
It looks and feels more like a product finance team than a traditional FP&A team. We spend a little time on cost, but it’s much more business cases, unit economics over time, program economics, and R&D investment, helping our leadership make resource allocation decisions.
Julian: Before we get into systems, what’s the technical baseline on your team?
Jeff: A core skill set on the team was always SQL. Everyone on my team knows SQL. We had to be able to go write and edit queries so that we didn’t have to wait on the data team.
And we’ve got some people on our team who came from GitHub’s finance team, so they already knew how it all worked. I think that helped.
The stack
Julian: I always like to ask about data systems. Where the data you care about lives, and what the tooling is, before we even get to the AI piece.
Jeff: Snowflake is where the warehouse sits. That’s our primary tool, and the source of truth for historicals, meaning all actual data. A year ago we were using Redash a lot, but we’ve since moved pretty heavily into Streamlit apps within Snowflake. That’s where we’re primarily building dashboards, data visualization, and now all our financial models.
We’ve got NetSuite, which flows one way into Snowflake. We use Pigment on the cost side, and that’s really the source of truth for cost forecasting. Pigment and Snowflake are two-way. Snowflake feeds Pigment, and Pigment feeds back. We send GL lines over, and we feed operational metrics into Pigment to run ratios on teams and staffing. For cost detail that isn’t in Snowflake, we just use the Pigment MCP.
Sales CRM and payroll flow into Snowflake too.
Julian: And what were Redash and Streamlit doing? I used to do data warehouse work for hedge funds, and that job was made obsolete by ChatGPT 3.5. I was the stable keeper and now they have cars. But I don’t know these tools.
Jeff: Redash is basically how we queried our tables. That’s how we got data out of Snowflake and into a CSV. We did a lot of visualization and charting there, and in Tableau, and that’s all moving into Streamlit now.
Streamlit is an application layer within Snowflake where you can build dashboards and build models. It also lets us write back into Snowflake. So there’s a daily update on daily data, and read and write. That’s where all our revenue models are now, so they’re instantly updated and automatically forecasted.
For anything the team builds, the code lives in a repo in GitHub, and we keep performance commentary and monthly context for every product in Notion.
Julian: How are you handling data mapping and master data management?
Jeff: We already had a unified data warehouse, and then we spent about the last year working with our data team creating a semantic layer of definitions. This is the field to use for customers. This is the field to use for this product’s ARR. This is the field, and this is the definition.
It’s been a lot of work over the last year building that layer on top, just to point people to the right data fields. Our data team set up an MCP into Snowflake that filters through the semantic layer, so anyone in the company can ask “how many customers did we have last month” and it knows to go through the semantic layer and pull the right data field. Huge kudos to our data team to enable this - we wouldn’t be here without them.
That’s how my team interacts with Snowflake, through the semantic layer. There’s a lot of work to set up all those definitions and go one by one by one through each of the products.
A year of hackathons
Julian: I’d love to hear about your journey with AI.
Jeff: About a year ago, as a team, we started doing monthly hackathons. We brought in OpenAI, we brought in Anthropic, we brought in Cursor. A full day working with a particular vendor, teams set up, a bit of a competition, just seeing what we could build. From a year ago we were really trying to push the envelope, or at least try lots of new solutions and rethink how we work.
Heading into January this year we were using a bunch of new tools, and then we got our hands on Claude. The immediate thing was the proliferation of dashboarding and visualization. Our ability to get to insight went from weeks to a minute. Access the data we wanted, run all sorts of slices, create dashboards.
Hosting was the challenge for a while. This was before artifacts really existed, and then there was a size limit on them. So we used a combination of Google Apps Script, Switchboard, and now Streamlit, which has become the big one for us.
Two or three months in, it was part of our every day. Something like 70% of everyone’s time on my team was working with Claude, creating dashboards. That’s how we made planning artifacts. We used it for board decks. We were writing HTML decks and communicating through pull requests in GitHub, which is how we did version control. By March or April, that was a genuinely new way of working.
Then we said, this has been amazing for personal productivity, we’ve stopped moving pixels on Google Slides, and we’re working our way out of spreadsheets. Now let’s capture the big work streams.
Project SHEEP (Spreadsheets Have Earned Eternal Peace)
Jeff: So for the last three months we’ve been focused on one thing. How do we move our revenue models out of spreadsheets. The project is called Project SHEEP, which stands for Spreadsheets Have Earned Eternal Peace - credit to the team leading the project who coined this.
We spent three months proving we can read and write into Snowflake, that we can replace what we were doing in Google Sheets, and that we can move all of our revenue model infrastructure into Streamlit.
The old workflow was hit execute on a query in Redash, download a CSV, copy and paste the data into a revenue model in Google Sheets, drag the formulas across, check all the little numbers that changed, then re-forecast the future periods. Then we used another google sheet to combine all outputs from these models into a consolidated view, which fed other reporting infrastructure. That was about a week of work for the team. Now it’s roughly twenty minutes of human-in-the-loop review.
The models are all just Python code. There are no LLMs in them. We built the Python with Claude.
Julian: What’s the time saving been, the number of days it used to take per month versus now?
Jeff: We used to deliver our forecast every month on business day 10. We’re aiming for business day 5 to be fully done with all revenue forecasts.
Julian: And are the historicals ready to go on day one? Is that half the time saving, or is that actually most of it?
Jeff: Accounting close moved from business day 7 to business day 4. My team will get down to accounting close plus one. So one day after close, we’ll have it.
Julian: So it was close plus three, and now it’s close plus one.
Jeff: Close plus three, yes.
Julian: 3x faster, for a business your size, is completely bananas.
Jeff: It’s remarkable just to hear my team talk about it. The aha moment of, oh my god, this thing that used to take me a couple of days takes a couple of minutes.
How the numbers get to people
Julian: How do you get the right data to the right people at the right time? My experience with finance business partnering is that you can write to a dashboard, but people don’t always look at the dashboard.
Jeff: Everyone on my team owns different revenue models and products, and they’ve got a workflow. The models now have performance versus actuals populated automatically, because it’s all coming from Snowflake. There’s about 20 different performance reviews across our 30 or so models and 40-plus products.
The performance commentary is automated with an agent that spins up, writes the commentary, a human reviews it, and it writes into Notion. Then that can be sent over Slack to the business partner. By the time they have their meeting, they’ve already reviewed the actuals and the commentary, so the meeting is just problem-solving.
Julian: And the agent is a plugin? Is it another company’s, or did you write your own?
Jeff: We made our own Claude plugin that sits in our team’s Claude Code marketplace. We’re training that agent all the time on what to focus on and what to dig into. I think of a plugin as a shared skill, so my team can leverage it the same way.
The hard part moved to the back end
Julian: What have you had to babysit, or double-check, or that’s been harder than you expected?
Jeff: The work has flipped. The first 80% is easy, and the last 20% is where everything is. It’s a common thing people say about AI now.
When you used to build a model, you were in every cell, every formula. You knew it. There was less to scrub, because you’d built it. Now the work has shifted to the back end, and there are a lot of iteration cycles to get comfortable with a model.
So we built another plugin that my team can run on their models any time. It deploys 8 agents to complete tasks that you would otherwise do in an excel workbook manually but with the power of AI. So this includes sensitizing every assumption, visualizing trends in line charts, highlighting what’s wrong and what to fix, and creating a flowchart map of the entire model, so you can see every calculation in a flowchart.
Julian: The flowchart thing caught my ear. The thing that sucks about models is all the nested functions. You’re saying you’ve built flowcharts that show the whole thing?
Jeff: Think about trace dependents in Excel. What this agent does is create a visual flowchart where each node is a calculation. It shows the calculation and the dependency downstream. You can click any endpoint in the financial model, revenue for a given product, and it shows you every calculation visually that feeds into it.
So what trace dependents does in Excel, this is that to the hundredth degree, in richness and in power, to quickly see what calculations are actually feeding a given output.
Julian: Those big blue arrows in Excel do not get you very far.
Jeff: Right. Now it’s a beautiful flowchart with little dots flowing between the boxes. It’s amazing. It delivers one of those aha moments when you look back at what you used to view as work and now view as toil.
Where operators feed the model
Julian: Forecasting is the scariest spot for me. Reporting and analysis, if you have all the data and the labels match, is just math. But modeling and forecasting are formulas creating numbers rather than typing in what someone’s going to pay you. Are you getting it right every single time?
Jeff: It’s all Python. There’s no LLM in it, it’s all deterministic, and we check the Python code. Who’s more likely to make a mistake, Python or a human with a fast, angry formula? That’s what we’re up against. I feel really good that the Python code is right, and that it’s doing what we want, because of the architecture we’ve put around it to check it and understand it. Python has long been a language for financial models, but the difference is that we didn’t need a team of engineers to build and maintain it - everyone on our team is writing Python with Claude.
Then there’s how we set the team up for what we call lifts, or initiatives. Team A wants to go do something, and in January it’s going to cause a 1% lift on a conversion rate. How do you put that in? So our models let an operator go in and say, I’m doing this initiative, I think it’ll do 1% conversion in January and ramp from there, tell me the impact. The model does that for them live. Then they can add it, and it goes into a queue for the finance person to review what the operator put in as an initiative. We talk about it, maybe have a conversation, and then it gets built into the model.
So across all the assumptions, there are opportunities to layer in additional lifts for given initiatives, so that our models tie to our operations.
Julian: It sounds like it’s been smooth. Nothing has broken that didn’t get caught?
Jeff: Not yet. To be fair, we proved read and write for all our models in Streamlit last week. Everything is mechanically sound. We’re spending this month doing all the audits and checks, and then we migrate next month. The goal is to delete our spreadsheets next month. That’ll be the moment. We haven’t done it yet. Right now we’re running Google Sheets and Python in parallel.
Julian: Did you ever feed the old models in as context for the Python that was replacing them?
Jeff: For sure, where there were models we felt good about the logic on. Where there were ones we’d been wanting to improve or re-architect, we took that opportunity instead. You can feed them in and it’s worked pretty well. But it gets you 80% of the way there. The long tail of getting to 100% confidence takes time.
The holy grail
Julian: Where do you want to get to?
Jeff: The near-term objective is that all of our recurring processes are 99% automated, and my team spends 100% of our time adding value. Solving problems, looking around the corner, highlighting risks and opportunities, catalyzing change and supporting the problem-solving with our leaders. All the recurring workflows, the model updates, the performance updates, the board decks, 99% automated.
Julian: Where were you on percentage automated a year ago? Six months ago? Now?
Jeff: Zero. Zero. 80%.
What I took away
Everyone should be sprinting at the semantic layer + unified data warehouse
I got genuinely excited when every CFO became obsessed with Claude, because it made the semantic layer + unified data warehouse so important, and at Cashboard we have spent years building one.
The reason Gusto could switch on Claude and have it work is that there was nothing left to assemble and no ambiguity about what anything meant. Every record from every system was already landing in one unified data warehouse, and every label was already tied to a single master definition. Everything that came after was still real work. But it was work they could start immediately, instead of after multiple years of heavy data engineering work.
If you’re at a mid-market company with no semantic layer and data warehouse, that’s the thing to sprint at. It’s the free lunch sitting right there. There are two ways to get it.
The Gusto path is to hire data engineers, wire up your integrations through something like Fivetran, stand up a Snowflake or BigQuery warehouse, and pipe everything in. Then write and maintain the scripts that match all your data labels together. That last part never ends, because there’s a new vendor or employee or customer or GL line every single day, and every one of them sends you back to engineering.
Or you can use Cashboard and have it in a couple of weeks. Every transaction and datapoint in a single unified data warehouse that’s always live. When a new label shows up, the humans get alerted, AI has a suggestion, and someone approves it with a click. No ticket to engineering.
Either way, that is the work. Everything else in this piece sits on top of it.
Faster FP&A compounds into company value
When I was a CFO, I sometimes found out three months later that we had a hole in the balance sheet. Three months of decisions made on a picture that was already wrong. Gusto’s leaders find out the day after close.
Every department leader gets granular detail on their own business immediately. Add a hundred more leaders and a thousand more employees and every one of them still gets their own snapshot, because of how it’s built. They see a bad trend the day it starts and can change something that day. They see a good one and double down while it’s still happening.
That’s hard to put in a business case, which is one of the perpetual frustrations of selling what I sell. But it compounds. Their competitors might grow 2x over a couple of years while they grow 10x, because of better decision making.
Gusto was at zero a year ago. There’s no better time than now to start.
About Jeff & Julian
Jeff Cobourn leads product and go-to-market finance at Gusto, where his team helps leaders make decisions to accelerate the business.
Julian Rowlands is the founder and CEO of Cashboard, the AI enablement platform for FP&A. He was previously CFO of Xendit (last valued at $3bn) and Head of Finance at Spruce (exited to Zillow in 2023). You can learn more about Cashboard at www.cashboard.co.
Interviews with CFOs about AI is an interview series by Cashboard. We speak with finance leaders who use AI in their day-to-day work, and ask them really detailed questions about their setup.
If you’re a finance leader building with AI, we’d love to interview you! Email julian.rowlands@cashboard.co with a quick summary of what you’ve used AI to accomplish, and we’ll get a call booked.
This is really cool
This is the most practical piece on implementing finance I've read in a while. I appreciate the breakdown of the tech stack, the hackathons, and the actual process transformation.