


Democratized, self-served performance data is what every company *says* they want.
The dream: let anyone in your business ask Claude a question and get good answers. Claude is already connected to your company’s systems (accounting, CRM, database, etc) – should be easy, right?
But when internal leaders actually run these queries, things will start to go wrong – and fast.
That’s because the people asking those questions *aren’t familiar with the shape or structure of the data that they’re querying*, which means they’ll inevitably ask questions that Claude can’t help but misinterpret.
And when Claude misinterprets a question, it’ll give a very confident and very wrong answer.
Fast forward to: chaos, recriminations, a great gnashing of teeth.
A semantic layer solves this problem. It’s like a seeing eye dog for people who aren’t close to the data. It’s how you make sure those people get good answers to the questions they *meant* to ask, even if they phrased things in a way that doesn’t match the underlying data structure.
So do you need a semantic layer?
Yes *if* if you want every department head making fast decisions off their own numbers. (But this requires CEO buy-in and a company-wide mandate – easier said than done!)
No if you’re happy with finance staying the middleman, or if you can’t get that company-wide mandate across the finish line.
Step 1 in answering this question: decide what kind of business you want to run.
This is a culture decision before it’s a software decision
The first question to ask: do you want every business unit leader to be responsible for knowing exactly what’s going on in their part of the business?
That means knowing how many new customers they brought in last month, what they’re spending against their budget, and what their team’s salaries actually add up to.
(I think you should definitely want this!)
If the answer is no – because you’re small, for example – stick with finance pulling and sending the performance numbers.
If the answer is yes, you have two ways to get there.
The first way – the classic, brutal way – is that finance is regularly pulling performance data, filtering it for each org, and sending it out with commentary. Every leader gets their numbers, and every number goes through finance first.
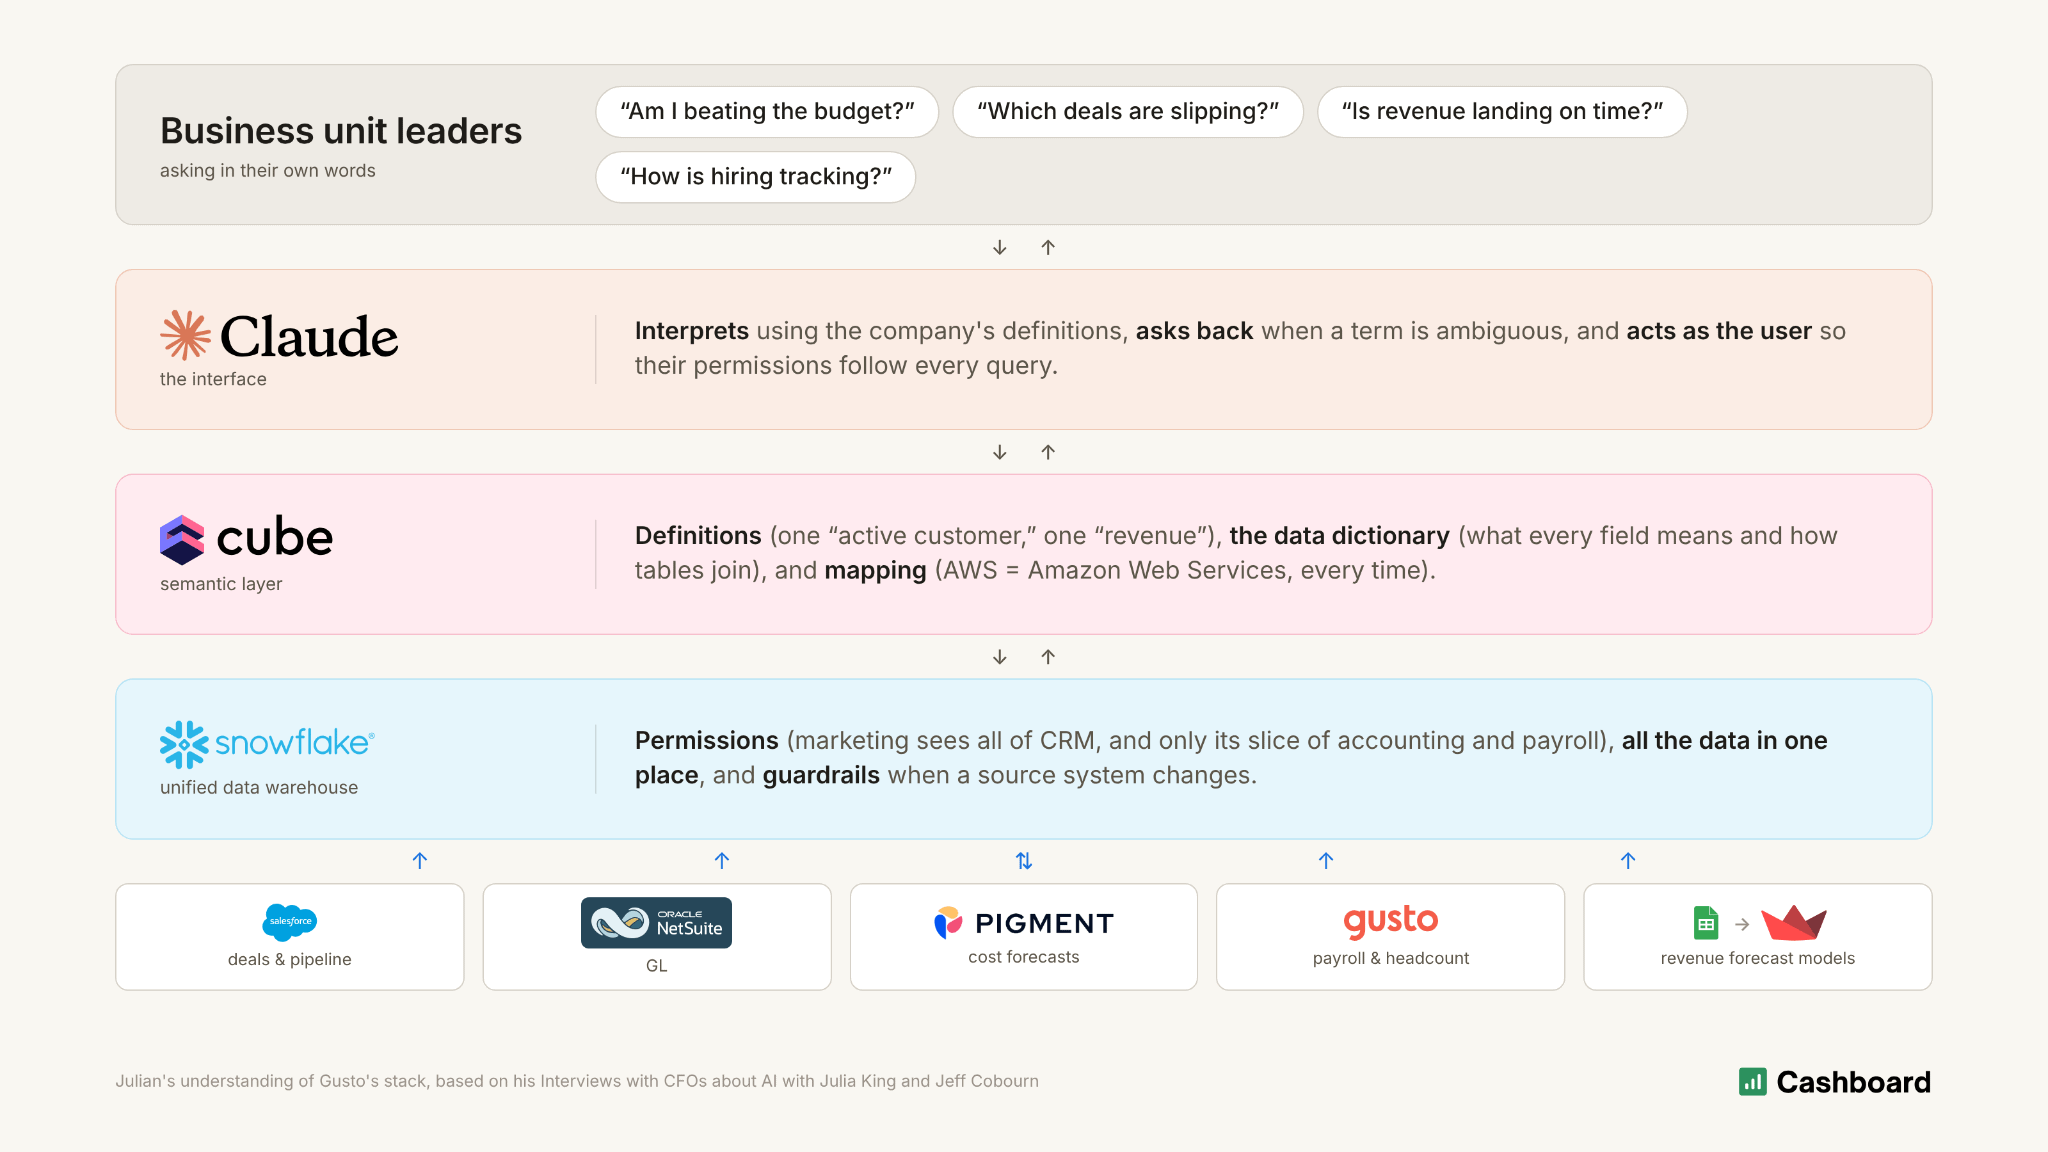
The second way – the way that Gusto does it – is to have org leaders self-serve their own numbers *in addition to* finance’s reporting.
They do this by using AI (ex: Claude) to query a semantic layer, which sits on top of a unified data warehouse configured with bespoke data access permissions tailored to each leader. The semantic layer makes sure queries are always correctly interpreted by the AI.
Now, let’s go deeper on what a semantic layer is.
A semantic layer is a seeing eye dog
A semantic layer helps someone who’s far from the data, and doesn’t know how it’s structured, get answers to the right questions.
Without one, people who don’t know how the data they’re querying is structured will ask unknowingly dumb questions.
Maybe they’re new, maybe they’ve never been allowed near that system, maybe they just don’t live in it every day. The questions make total sense in a vacuum.
But because they’re blind to the data structures they’re querying, Claude will answer wrong. Or more specifically: Claude will give the right answer *to the wrong question*, instead of translating their query into the question *they meant to ask*.
Finance people mostly don’t run into this, at least not when querying financial data or key performance datasets. That’s because they work in the general ledger, the CRM and payroll every day, so they know how the data is stored and naturally ask questions in a way that matches it.
The problem shows up when *everyone else* starts asking, and if you want the business to move fast, everyone else is exactly who you need asking these questions.
A semantic layer is the data unlock that allows individual business units to be self-sufficient and make fast + correct decisions.
Fast business units are how a company compounds
Letting business units make their own decisions and move quickly is how a company compounds growth. You end up with a bunch of little CEOs, each running their own corner of the business, and none of them waiting on anybody to find out how they’re doing.
Napoleon figured this out and used it to conquer most of Europe.
(Forgive me a quick nerd-fest here – I wrote my college thesis on military history, and I’ve been waiting fifteen years for it to be useful at work. My time has come!)
Most armies of his day considered about 10 miles a day when traveling. But Napoleon’s army routinely covered 15 to 20. He did it by splitting his troops into corps, independent mini armies with their own infantry, cavalry and artillery, that marched on separate roads and spread out across the map but stayed within a day’s march of each other so they could back each other up.
They lived off the land, and no longer needed to wait on the supply wagons, while his opponents were still tied to fixed supply lines and moving at the speed of their slowest cart.
In a company, data is the supply line. If every question has to go back to finance, you’re the army waiting on the supply wagons before you can move.
Then there’s the opposite story: Louis XIV.
Starting in 1661, Louis’ finance minister Jean-Baptiste Colbert gave him a full account of the country’s revenue, spending and assets twice a year, written up in little gold-embossed books small enough to carry in his coat pocket. It was the first time a sovereign ruler had access to his country’s complete financial records. But when Colbert died in 1683, Louis stopped looking at them.
At the end of his 72 year reign – spent almost entirely at war with other European powers – France was nearly destitute. He didn’t know the numbers.
(Jacob Soll tells the whole Louis XIV story in The Reckoning, his phenomenal history of accounting, which I can’t recommend enough if you’re the kind of person who enjoys this newsletter.)
Be like Napoleon, and not like Louis XIV. Democratize your data access so that your company can compound faster.
Example: How a semantic layer solves business problems in realtime
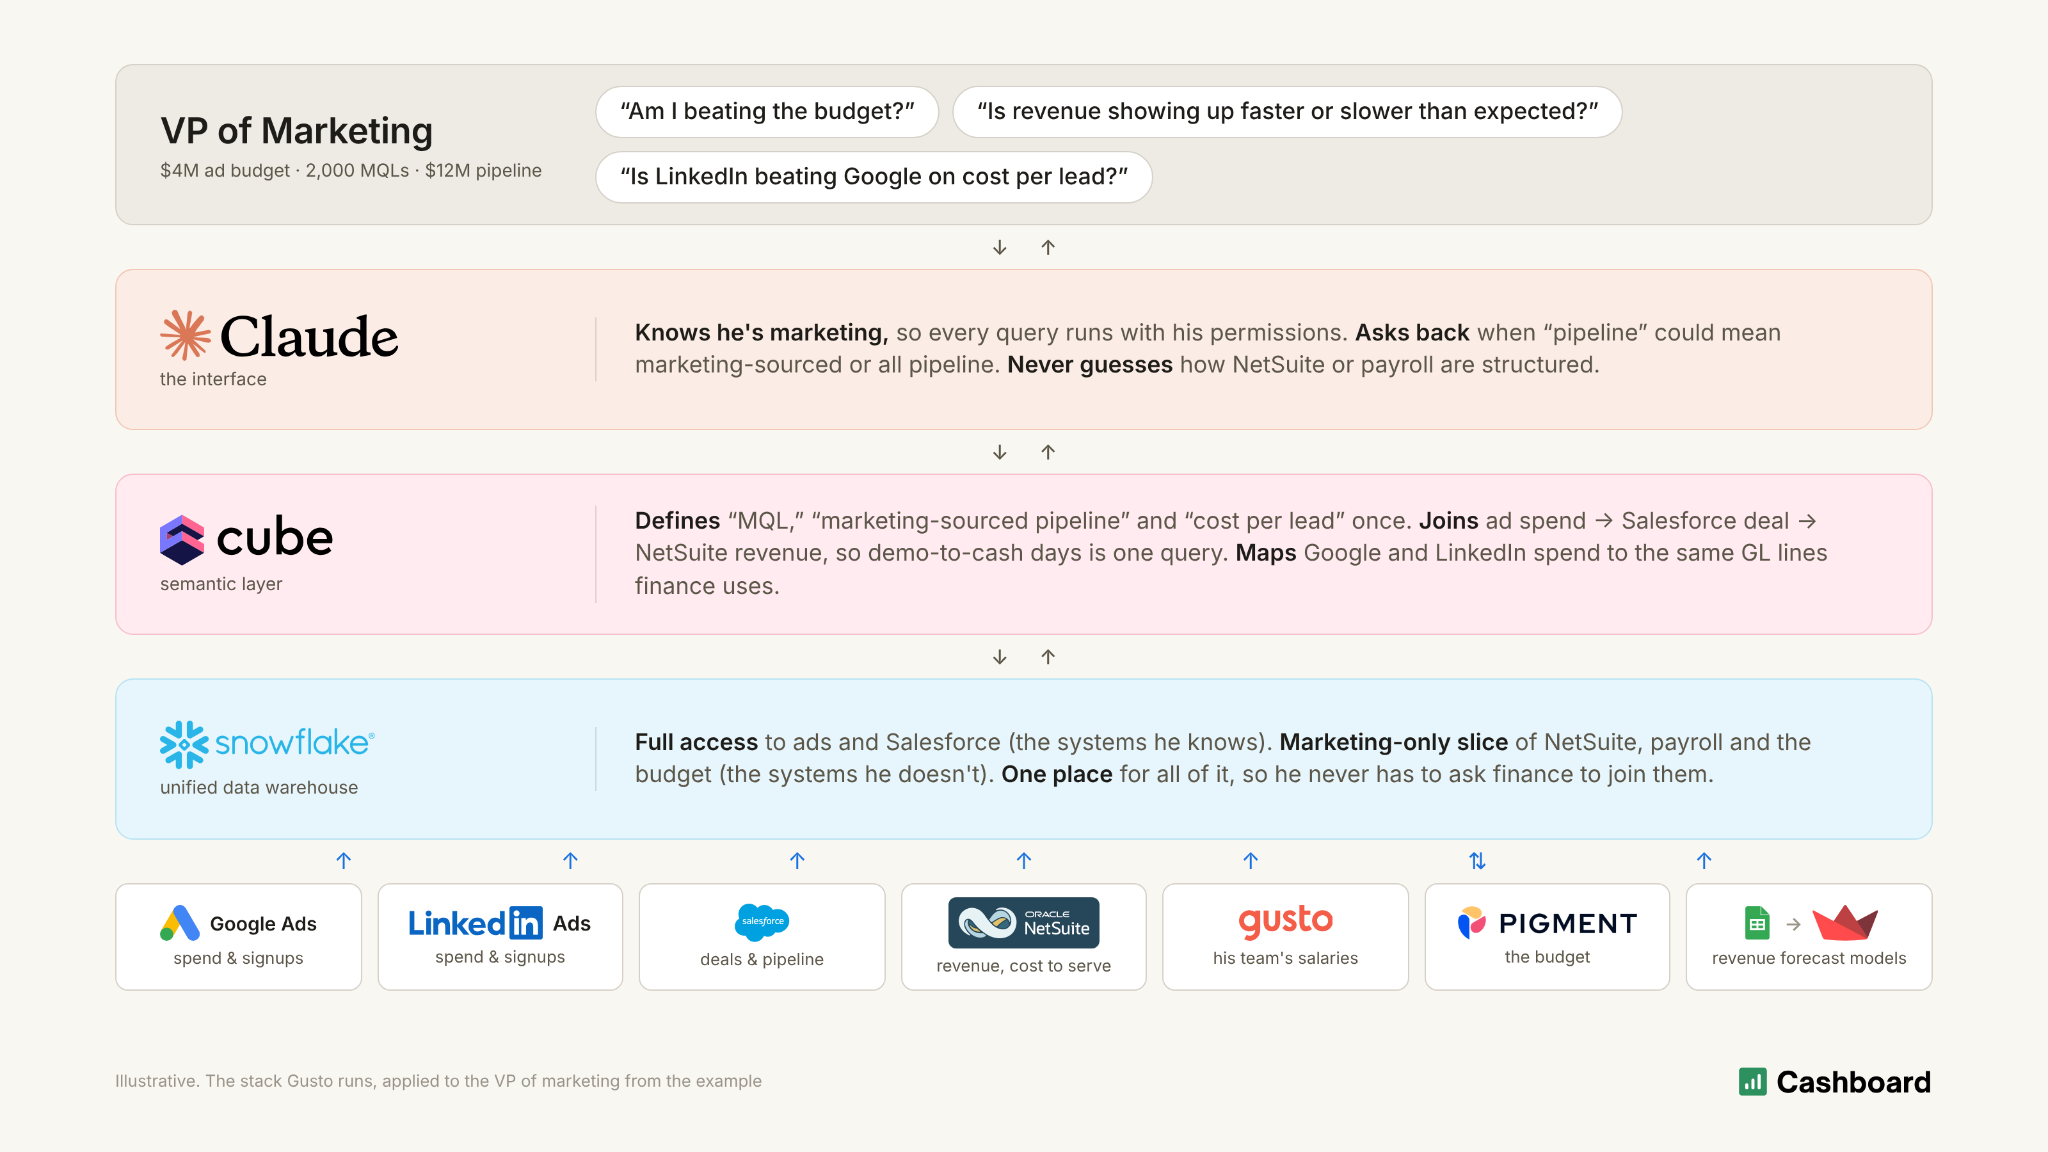
Take a VP of marketing at a software company who’s setting next year’s budget.
He’s got roughly $4 million in ad spend. A small slice goes to brand marketing. The other $3 million or so goes to demand generation, mostly Google and LinkedIn ads.
His targets for next year are:
2,000 marketing qualified leads
$12 million of marketing sourced pipeline handed to sales, and
$6 million of total spend across salaries, vendors and ad campaigns
Ideally he has an equation built from past years that calculates this many dollars on this platform produces this much pipeline, and knows that x pipeline should turn into y revenue.
The goal is to get similar results at a bigger budget, and that’s where it gets hard, because spend levels change what works. If you double your Google spend, do you get twice the revenue or 10% more?
The only way to find out is to spend, watch the results, and move money between channels as data comes in.
Google worked well last year, so he puts 90% of the ad spend there and 10% into LinkedIn.
Hypothetical outcome 1 (bad):
Three months in he realizes Google isn’t working anymore (the equation broke) and LinkedIn is.
He moves the money, but by then he’s spent roughly $675,000 on Google ads that weren’t working, and he has nine months left to hit a full-year target.
Spoiler: he’s going to come up short.
Hypothetical outcome 2 (bad):
Google is working, so he stays the course.
But something about product market fit has changed and those deals aren’t converting to revenue as quickly as they used to.
He can’t see that revenue is converting slowly, so he never changes strategy.
He hits his lead and pipeline targets, but far fewer of those deals close and pay out this year than planned.
Outcome: the company misses its revenue number.
Hypothetical outcome 3 (good!):
Two weeks in he sees more coming out of LinkedIn than Google, so he starts shifting spend over and doubles down when it keeps working.
Instead of $675,000, he’s capped his Google losses at $100,000, and the rest of the year’s budget goes to the channel that’s actually producing.
Outcome: He hits his 2,000 leads and his $12 million of pipeline.
The difference between those three outcomes: how fast he sees the data.
But he can’t do this by default because his data lives in five different places, and he doesn’t know how the data is structured.
To solve this, the company needs two things.
The first is a unified data warehouse that combines all the data from all of those systems in one place.
You can also set up role-specific access permissions in the data warehouse. For example, the marketing leader could be granted full visibility into the ads and Salesforce data, and marketing-specific filtered visibility into accounting, payroll and budget.
(Data leaders consistently tell us Snowflake works best for both data storage & access permissioning purposes)
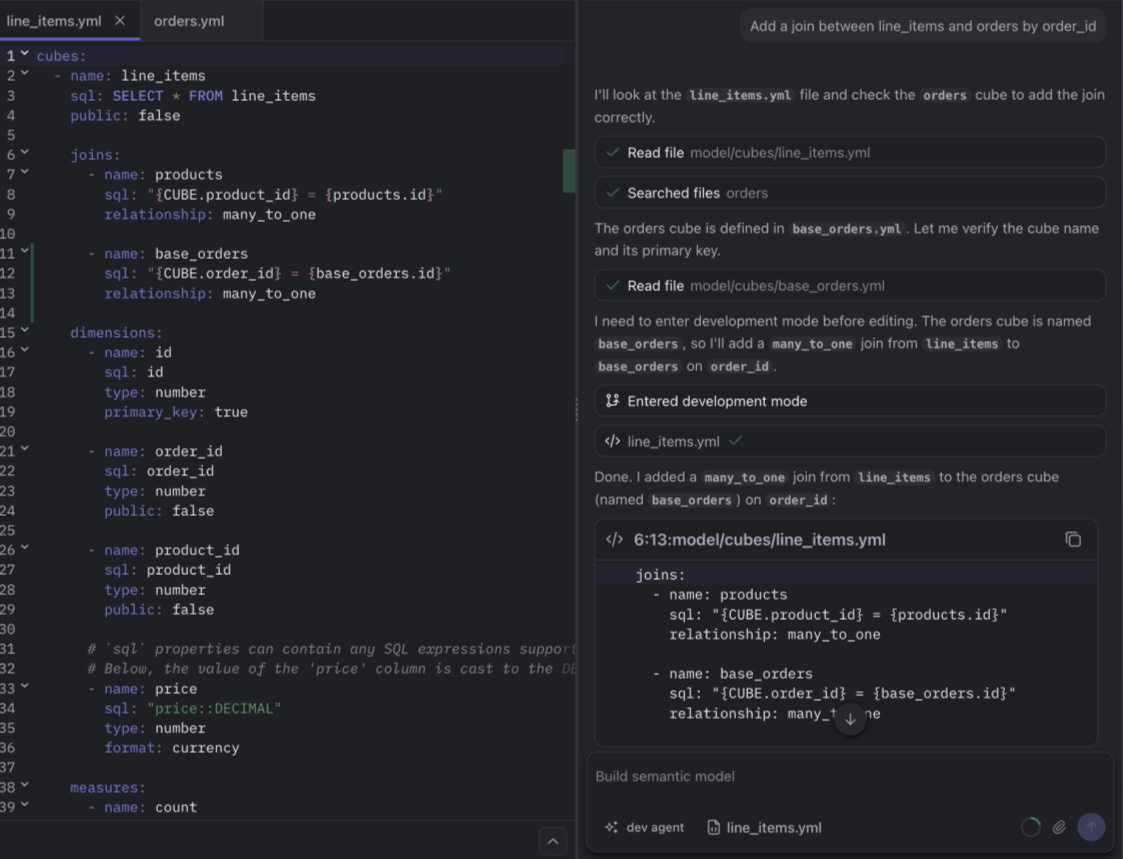
The second is a semantic layer that translates the fields in that warehouse into the way a business leader like him actually thinks about them. Gusto uses Cube.
The semantic layer sits on top of the warehouse and is connected to his Claude, which respects his permissions. When he asks Claude something about data he doesn’t know, like accounting, the semantic layer translates the question properly, because the data team already solved that problem, and he gets the answer to the question he meant to ask instead of the question he actually asked.
Without it, he’ll get confident answers to the wrong questions.
But with the semantic layer in place, he can save his year.
Decide what kind of company you want to be first
So, should you have a semantic layer? It all goes back to the question from the top of this piece. Do you want every department head responsible for knowing what’s going on in their part of the business, and able to check it themselves?
If the answer is no, keep finance as the middleman. It’s slower, but it works fine when only a handful of people need the numbers.
If the answer is yes, you should set up a unified data warehouse, permissions so each leader only sees their own slice, and a semantic layer so Claude answers the question they meant to ask. That’s how you get a company full of little CEOs who catch their own problems in realtime, instead of a quarter too late.
There’s great software out there for semantic layers (again, Gusto recommends Cube.dev).
But you’ll have to build the definitions yourself. Someone on your data team has to sit down and decide what revenue, an active customer and a marketing qualified lead actually mean, write those definitions down in the semantic layer, and take ongoing ownership of them. Gusto’s data team spent about a year doing exactly that.
It’s slow, unglamorous work, but it’s the difference between an army waiting on the supply wagons and one that’s already twenty miles down the road.
Julian Rowlands is the founder and CEO of Cashboard, the AI FP&A platform. He was previously CFO of Xendit (last valued at $3bn) and Head of Finance at Spruce (exited to Zillow in 2023). You can learn more about Cashboard at www.cashboard.co.
This is an excellent point and I think it speaks to the importance of context management when working with data